Top 10 Data Analysis Tools in 2026: Enterprise Guide
Last Updated: March 9, 2026 TL;DR: Key Takeaways on Data Analysis Tools for 2026 AI-powered platforms democratize analytics for non-technical users through natu...

Last Updated: March 9, 2026
TL;DR: Key Takeaways on Data Analysis Tools for 2026
- AI-powered platforms democratize analytics for non-technical users through natural language interfaces
- Organizations need composable stacks combining spreadsheets, BI tools, and specialized platforms
- Power BI, Tableau, and Python dominate different segments of enterprise analytics
- Predictive maintenance and demand forecasting drive supply chain and operational efficiency
- Training and data governance are as critical as tool selection for successful implementation
Table of Contents
- What Are Data Analysis Tools and Why They Matter in 2026
- Microsoft Power BI: The Enterprise Standard for Unified Analytics
- Python and SQL: The Programmer's Foundation for Advanced Analytics
- Tableau and ThoughtSpot: Visualization and Natural Language Analytics
- Cloud Data Warehouses: Snowflake, Databricks, and BigQuery Infrastructure
- AI-Native Platforms: Julius, Polymer, and Automated Analytics
- Data Integration and Governance: Fivetran, Informatica, and Talend
- Predictive Analytics for Supply Chain and Operational Excellence
- Choosing Your Data Analysis Stack: A Framework for Enterprise Buyers
- FAQ: Common Questions About Data Analysis Tools in 2026
- Conclusion: Building Your Data-Driven Organization in 2026
What Are Data Analysis Tools and Why They Matter in 2026
Data analysis tools are software platforms that collect, clean, organize, and interpret large datasets to transform raw information into actionable insights. In 2026, they're no longer optional infrastructure; they're survival equipment for any organization trying to compete.
The numbers make this urgent. With 328.77 million terabytes of data created per day, most organizations are drowning in information they can't effectively process. Without the right tools, that data becomes noise instead of signal. Your competitors are already sorting through it.
What's changed dramatically since even three years ago is accessibility. Data analysis tools now integrate AI and automation, which means you don't need a PhD in statistics to extract meaningful patterns. The barrier to entry has dropped significantly, democratizing analytics across departments and skill levels.

The enterprise landscape has also shifted away from single-vendor lock-in. Composable analytics stacks, where you mix and match specialized tools that work together, now outperform monolithic platforms. This flexibility matters when your data needs evolve faster than any vendor can keep pace.
Whether you're analyzing customer behavior, optimizing operations, or predicting market shifts, the fundamental challenge remains identical: turning complexity into clarity. That's what these tools do. The question isn't whether you need them anymore. It's which combination will best serve your specific enterprise priorities.
Microsoft Power BI: The Enterprise Standard for Unified Analytics
Microsoft Power BI remains the default analytics choice for enterprises already committed to the Microsoft ecosystem. Power BI leads Gartner's Magic Quadrant for 2026 analytics platforms, reinforcing its position as the market leader for corporate reporting.
The real advantage lies in integration. If your organization runs on Microsoft 365, Power BI connects seamlessly with Excel, SharePoint, Teams, and Azure. Your team already knows these tools; adoption friction drops significantly. Data flows naturally between systems without complex connectors or middleware.
Pricing makes enterprise-wide deployment realistic. The Pro tier costs $14 per user per month, making it competitive for scaling across departments. Premium capacity options suit larger deployments where you need dedicated computing resources.
Where Power BI truly differentiates itself is its AI capabilities. The Copilot features have matured considerably in 2026, allowing analysts to generate complex reports using natural language. Instead of manually building visualizations, you describe what you need, and the system creates it. AI Insights automatically flag anomalies and trends in your data, surfacing problems before stakeholders ask questions.
This combination of ecosystem fit, reasonable cost, and intelligent automation explains Power BI's enterprise dominance. It's not the flashiest tool, but it's reliable, scalable, and delivers measurable ROI for organizations with existing Microsoft investments.
Python and SQL: The Programmer's Foundation for Advanced Analytics
For organizations serious about extracting insights from complex datasets, Python and SQL form the backbone of enterprise analytics. Python is the undisputed best data analytics tool to learn for anyone serious about a career in data, and for good reason: its ecosystem of libraries like pandas, NumPy, and Matplotlib enables sophisticated data manipulation and visualization that point-and-click tools simply can't match.
SQL remains equally indispensable. Every major database platform supports it, making SQL the universal language for querying structured data. Your analysts can write once and deploy across systems without relearning syntax. For teams managing terabytes of enterprise data, this consistency matters.
The real power emerges when you combine these languages. Python handles the creative heavy lifting: machine learning models, custom ETL pipelines, and predictive analytics. SQL efficiently retrieves exactly what you need from databases. Together, they unlock capabilities that visual tools can't provide.
One emerging consideration for 2026: the rise of Polars has provided a speed boost for memory-intensive operations compared to Pandas. If your team processes massive datasets regularly, Polars deserves evaluation.
The trade-off is clear. Python and SQL demand genuine technical skill and longer development cycles than drag-and-drop platforms. However, the ROI justifies the investment: your analysts gain flexibility to solve novel problems, reduce vendor lock-in, and build reproducible workflows that scale. For enterprises moving beyond standard reporting into advanced analytics, these languages aren't optional.
Tableau and ThoughtSpot: Visualization and Natural Language Analytics
When it comes to visualization-focused analytics, Tableau and ThoughtSpot solve different problems for enterprise teams.
Tableau excels at building interactive dashboards where analysts and business users collaborate seamlessly. Its drag-and-drop interface requires minimal coding, while Tableau Prep handles the messy work of data cleaning and transformation. You get deep integration with enterprise data sources and the flexibility to create virtually any visualization your stakeholders need. The learning curve is manageable, making it ideal for organizations with mixed technical skill levels.
ThoughtSpot takes a fundamentally different approach. Instead of building dashboards first, you ask questions in plain English. "What drove Q3 revenue changes?" or "Which customer segments are churning?" The platform returns instant, actionable insights without requiring dashboard navigation. ThoughtSpot is a modern AI-driven BI platform that helps democratize data analytics through natural language queries, eliminating the wait for analysts to build custom reports.
The real distinction: Tableau suits exploratory analysis and polished reporting, while ThoughtSpot powers ad-hoc discovery at scale. Choose Tableau when your team needs sophisticated visualizations and dashboard governance. Choose ThoughtSpot when you want business users finding answers independently, without asking IT or analytics teams.
Both platforms handle complex enterprise data effectively. The difference is workflow. Tableau requires upfront dashboard design; ThoughtSpot empowers users to explore data on demand. Your choice depends on whether you're building a centralized reporting hub or democratizing analytics across your organization.
Cloud Data Warehouses: Snowflake, Databricks, and BigQuery Infrastructure
The shift from legacy on-premises data warehouses to cloud-native platforms has fundamentally changed how enterprises handle analytics at scale. These modern infrastructures eliminate the hardware constraints that once limited data processing speed and storage capacity.
Snowflake has evolved into a full Data Cloud platform that goes beyond traditional warehousing. The ability to share data securely across organizations and departments, combined with native Python support, makes it particularly valuable for enterprises managing complex analytical workflows across multiple business units.
Databricks takes a different approach with its Lakehouse architecture, which deliberately blurs the boundaries between data engineering and analysis. Rather than forcing data into rigid warehouse schemas, the Lakehouse combines the scalability and flexibility of data lakes with the governance and reliability you'd expect from a traditional warehouse. This matters enormously for supply chain teams who need both raw event data and aggregated metrics in the same platform, without expensive data duplication.
What makes these platforms strategically important is their native support for Python and collaborative workflows. Data scientists, analysts, and engineers can work in the same environment using notebooks, eliminating handoffs that typically slow down insights. Real-time analytics capabilities enable supply chain visibility and financial services risk monitoring that would have required separate specialized systems just years ago.
Cost efficiency drives adoption too. Cloud warehouses charge based on actual compute and storage usage rather than fixed infrastructure, which appeals to enterprises managing variable workloads. This flexibility, combined with cross-organization data sharing capabilities, positions these platforms as essential infrastructure for modern data strategies rather than just analytical tools.
AI-Native Platforms: Julius, Polymer, and Automated Analytics
The latest wave of data analysis tools is fundamentally changing who can extract insights from data. Rather than requiring SQL expertise or Python skills, AI-native platforms let business users ask questions in plain English and get visualized answers instantly.
Julius AI answers questions through conversation without SQL or Python knowledge, transforming raw datasets into charts through natural language interaction. You simply upload your data, ask what you want to know, and the platform handles the technical lifting. It starts at $37 per month with saved workflows, Google integrations, and scheduled reports, making it accessible even for lean teams.
Polymer takes automation further by generating dashboards from raw data automatically with AI identifying patterns and suggesting charts. Instead of manually building each visualization, the tool analyzes your dataset, spots relationships, and proposes relevant dashboard layouts. You review and refine rather than build from scratch.
What makes these platforms valuable for enterprises isn't just their affordability in the $25-50/month range. They collapse the analysis timeline from days to hours. Your marketing team can answer budget performance questions without waiting for analytics support. Finance can investigate variances without involving data engineers. This democratization means faster decision-making at every level.
The real advantage emerges when you combine these tools with your existing workflow. Scheduled reports push insights directly to stakeholders. Integrations with Google Sheets and other services keep data flowing seamlessly. For organizations moving beyond spreadsheets but not ready for complex BI platforms, these AI-native solutions bridge the gap efficiently.
Data Integration and Governance: Fivetran, Informatica, and Talend
Data integration forms the backbone of enterprise analytics, yet many organizations treat it as an afterthought. This mistake compounds quickly, creating siloed systems and unreliable reporting that undermine decision-making.
Fivetran is used by analytics teams wanting reliable, low-maintenance ways to keep analytics environments updated, handling connectors to hundreds of data sources without requiring constant engineering intervention. For teams prioritizing stability over customization, this hands-off approach saves considerable resources.
Informatica IDMC is a comprehensive cloud-native platform supporting data integration, quality, governance, and metadata intelligence, making it the choice for large enterprises managing complex regulatory requirements. Financial services, energy, and national security agencies particularly rely on its governance capabilities to ensure compliance and audit trails.
Talend is a data integration platform supporting ETL, ELT, data preparation, and governance with open-source roots, offering flexibility for organizations wanting to balance commercial support with community-driven innovation. Its data quality features catch errors before they propagate through your analytics stack.
The real value emerges when these tools work together with your governance framework. Clean data pipelines eliminate errors at the source, enabling consistent analytics across departments. Supply chain teams get accurate inventory visibility; finance teams maintain audit-ready records; security operations receive trustworthy threat intelligence. Without this foundation, even sophisticated AI-driven analysis produces questionable results. Invest here first.
Predictive Analytics for Supply Chain and Operational Excellence
Predictive analytics transforms supply chain management from reactive firefighting into strategic foresight. When equipment fails unexpectedly, production halts. When demand spikes without warning, stockouts damage revenue. When inventory sits idle, capital ties up needlessly. Data analysis tools solve these problems by learning from historical patterns, sensor data, and market signals to anticipate what's coming next.
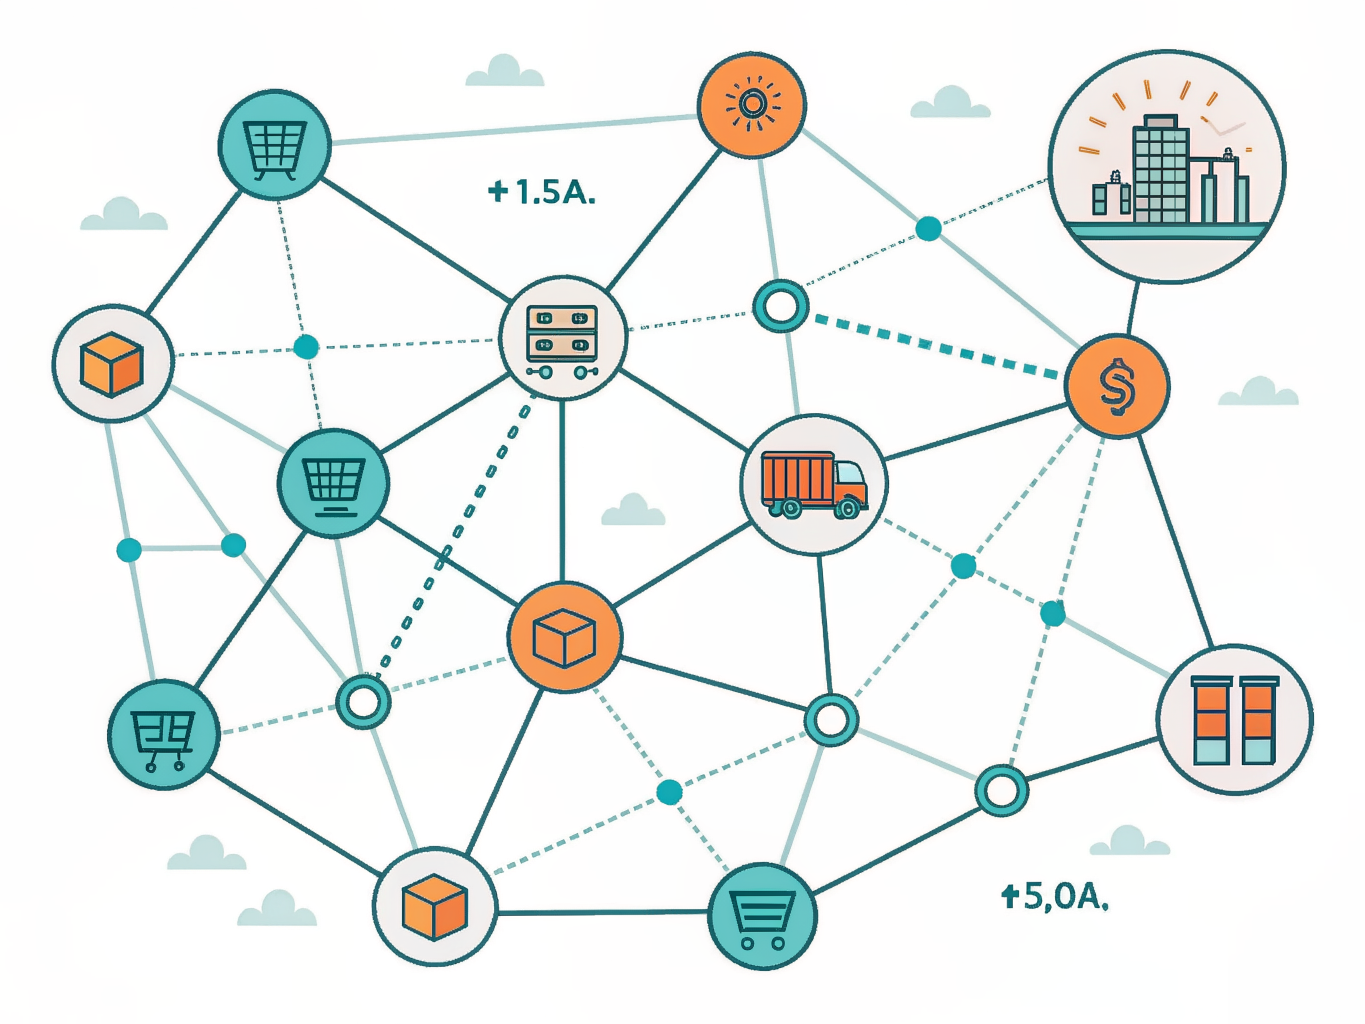
Consider the numbers: 77% of logistics partners invest in predictive analytics to boost profitability. That's not theoretical interest; that's capital allocation based on proven ROI.
Walmart demonstrates this at scale, using AI and machine learning models to analyze sales data, search behavior, and page views to identify supply chain inefficiencies before they cascade. DHL and Maersk similarly leverage predictive models to optimize routing, anticipate demand fluctuations, and allocate resources where they matter most.
The mechanics are straightforward. Predictive maintenance analyzes production logs and equipment sensor data to flag deteriorating conditions before costly breakdowns occur. Demand forecasting ingests multi-variable inputs, from seasonal trends to economic indicators, generating accurate projections that reduce both stockouts and excess inventory. Real-time visibility through analytics dashboards enables operations teams to respond to disruptions within hours rather than days.
The result: lower operational costs, reduced waste, faster decision-making, and supply chains that bend without breaking. For enterprises managing complex global networks, predictive analytics isn't optional anymore; it's the difference between outperforming competitors and falling behind.
Choosing Your Data Analysis Stack: A Framework for Enterprise Buyers
The best data analysis tool is the one your team will actually use, not necessarily the one with the most features. This principle should anchor every purchasing decision you make.
Most enterprises fail not because they chose the wrong software, but because they underestimated implementation complexity. You'll need a composable stack combining specialized tools rather than betting everything on a single platform. One tool might excel at data warehousing, another at visualization, and a third at predictive analytics. This modular approach gives you flexibility and prevents vendor lock-in.
Budget realistically for adoption. Even user-friendly BI tools require 20-40 hours of training per user to achieve proficiency. Training isn't optional; it's foundational. Without it, your expensive new platform becomes expensive shelf-ware.
Before selecting tools, audit three critical areas: your team's technical skills, your data infrastructure's complexity, and integration demands with legacy systems. A tool that requires deep SQL knowledge won't work if your analysts use Excel. Similarly, connecting to outdated databases might consume more time than the tool itself saves.
Finally, establish data governance early. Democratizing insights across your organization requires clear policies about data access, quality standards, and documentation. The tool itself is just infrastructure; your success depends on whether people trust the data and understand how to use it.
Start with your actual business problems, not vendor marketing. The right stack solves your specific challenges while your team can realistically support it.
FAQ: Common Questions About Data Analysis Tools in 2026
Is Excel really becoming obsolete?
Not even close. Despite the explosion of specialized tools, 81% of businesses still rely on Excel for ad-hoc analysis. Its flexibility, familiarity, and zero learning curve keep it indispensable for quick explorations and one-off reports. The difference is how it fits into your toolkit: Excel now works alongside dedicated platforms rather than replacing them entirely.
What's the best tool for someone just starting out?
Microsoft Excel and Power BI remain the best data analysis tools for beginners. Both have intuitive interfaces that don't require coding knowledge. Power BI gives you a bridge into enterprise-grade analytics while maintaining that accessibility. Start here, then branch into specialized tools as your needs grow.
How does AI actually change what analysts do?
This is the real shift. AI is moving analytics toward autonomous insight generation, where analysts focus on strategy rather than manual data preparation. You're becoming an editor of machine-generated insights rather than their creator. This means less time wrangling data, more time asking better questions.
What's the real cost beyond the software price?
Budget for integration, training, governance, and ongoing support. A tool might cost $500 monthly but require months of implementation and dedicated staff. Simple solutions deploy in weeks; enterprise platforms take three to six months. Factor these costs into your ROI calculations from day one.
Conclusion: Building Your Data-Driven Organization in 2026
Selecting the right data analysis tools is just the beginning. The real transformation happens when organizations commit to the harder work: building a culture where data informs every decision, from the C-suite to frontline operations.
Your supply chain managers won't benefit from sophisticated analytics if they lack training. Your security agencies need governance frameworks that ensure data quality and compliance. Your energy companies require buy-in from stakeholders who understand why the shift matters. Municipal planners need leadership that champions data-driven urban planning over tradition alone.
Start small. Pilot projects with cross-functional teams prove value quickly and build internal advocates. A supply chain optimization pilot or a security threat detection prototype generates wins that justify broader investment. Success here translates to budget approval and team enthusiasm for scaling.

Remember, as AI-powered platforms mature, they'll handle routine analysis, freeing your analysts to focus on strategy. The best tool isn't the flashiest; it's the one your team actually uses daily. Composable stacks let you adapt as technology evolves and business needs shift.
Your 2026 competitive advantage doesn't come from any single platform. It comes from people, processes, and commitment. Invest in training. Establish clear governance. Measure adoption. The tools amplify what you build together.
Keep reading

Critical Third Parties: UK Cloud Rule Explained
A Critical Third Party is a provider whose service failure could threaten UK financial stability. The first UK designations are four cloud providers.

Netflix Earnings Put Always-On TV in Focus
Netflix reports Q2 results July 16 after reports it is weighing always-on channels. Arkolith maps NFLX to $284.0B in tracked 13F value.

UK Cloud Watchlist Maps to $4.45T in 13F Value
The UK's first cloud oversight list maps to Microsoft, Alphabet, Amazon and Oracle, which Arkolith tracks across $4.45T of Q1 2026 13F value.