Real-Time Data Analytics Architecture: Design Guide 2026
Last Updated: March 10, 2026 TL;DR: Real-Time Data Analytics Architecture Essentials Real-time architecture processes events as they happen, delivering insights...
Last Updated: March 10, 2026
TL;DR: Real-Time Data Analytics Architecture Essentials
- Real-time architecture processes events as they happen, delivering insights within seconds rather than hours
- Core components: streaming platforms (Kafka), stream processors (Flink), real-time databases (Druid), and APIs
- CDC and event streaming enable continuous data ingestion; exactly-once semantics critical for compliance
- Successful designs balance data latency, processing latency, and operational complexity across layers
Table of Contents
- What Is Real-Time Data Analytics Architecture?
- Core Components of Real-Time Analytics Architecture
- Streaming Platforms and Data Ingestion Patterns
- Stream Processing, Storage, and Exactly-Once Semantics
- Real-Time Databases and API Layers
- Real-Time Analytics Patterns: Fraud Detection, Inventory, and Supply Chain
- Design Principles, Challenges, and Implementation Roadmap
- Conclusion: Building Your Real-Time Analytics Foundation
What Is Real-Time Data Analytics Architecture?
In traditional batch processing, you wait. Data sits in storage until a scheduled job runs, hours or days later. By then, your supply chain disruption has already cascaded, your fraud has already drained accounts, your operational problem has already compounded.
Real-time data analytics architecture flips this entirely. As events occur, your system processes them immediately, generating insights and alerts within seconds to minutes rather than waiting for tomorrow's report. Real-time analytics treats data as a stream and computes incremental results like counts, joins, and predictions as new events arrive.
The competitive pressure is real. A supply chain manager using real-time visibility catches a shipment delay before customers even notice the impact. A financial services firm detects fraud in milliseconds instead of discovering it in a weekly audit. An operations team responds to equipment anomalies before failure, not after.
Real-time data warehouses use change data capture to make data queryable within seconds to minutes of creation at the source, enabling proactive decisions rather than reactive firefighting. This shift from historical reporting to live operational intelligence is where competitive advantage lives.
The stakes are straightforward: delayed insights cost money. Every hour your supply chain visibility lags is a missed opportunity to optimize. Every minute your fraud detection waits is exposure you didn't need. Real-time architecture isn't a luxury feature anymore; it's table stakes in industries where speed determines survival.
Core Components of Real-Time Analytics Architecture
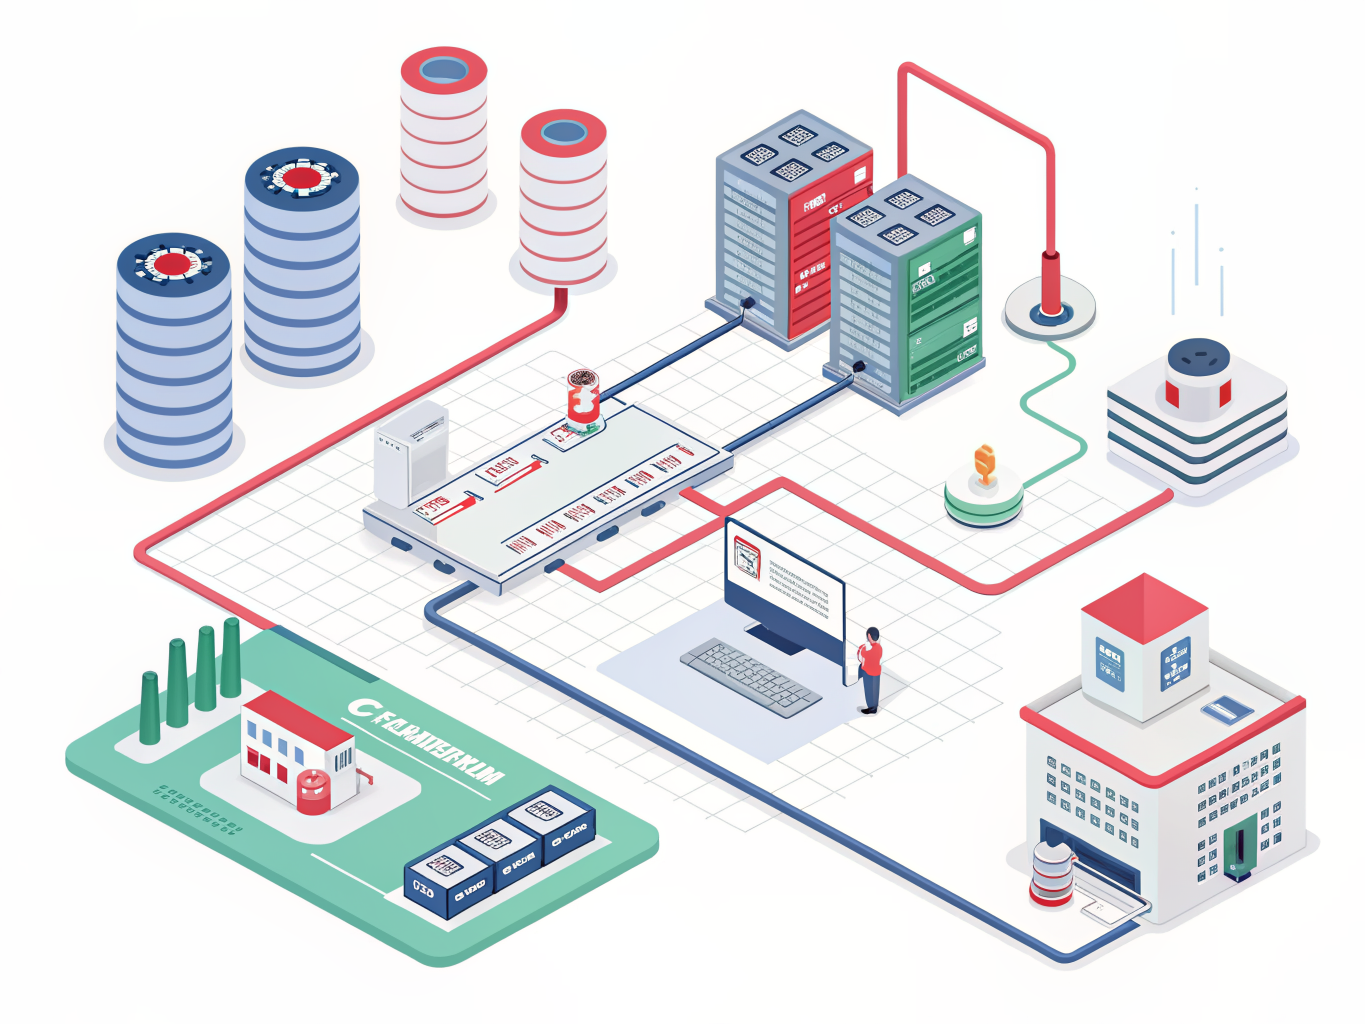
Think of real-time analytics architecture as a five-stage assembly line, where each component has a specific job and depends on the others to function properly.
Data sources kick things off. These are your IoT sensors tracking warehouse temperatures, payment systems logging transactions, or supply chain systems reporting shipment status. The volume and variety matter: a retail operation might ingest millions of events per second across checkout systems, inventory updates, and customer interactions.
Streaming platforms like Apache Kafka act as your nervous system, reliably moving those events from source to processor without losing a single message. Unlike traditional messaging queues, streaming platforms overcome scale limitations by enabling high-throughput pub/sub architecture. They handle the buffering, routing, and durability so downstream systems don't get overwhelmed.
Stream processors transform raw events into actionable insights. They aggregate data across time windows (calculate average response times every 10 seconds), enrich events (join customer transactions with profile data), and filter noise. Tools like Apache Flink or Kafka Streams work continuously, never stopping to wait for a full dataset.
Real-time databases store processed results for fast retrieval. Databases like ClickHouse, Pinot, and Druid are optimized for high-frequency ingestion and low-latency queries, making them ideal for analytics. A finance team querying fraud patterns or a supply chain manager checking inventory levels needs answers in milliseconds, not minutes.
APIs and visualization layers expose these insights to applications and dashboards. A dashboard showing live order fulfillment rates, a microservice triggering alerts when thresholds break, or a BI tool pulling metrics for reports all connect through this layer.
The critical insight: don't treat these as independent components. They're interdependent. A bottleneck in your streaming platform starves your processors. Undersized databases cause latency spikes. Orchestrate them as one system, and you've built something that actually scales.
Streaming Platforms and Data Ingestion Patterns
Your streaming platform is the backbone of real-time analytics. It must handle high throughput, guarantee message durability, and preserve event ordering. Apache Kafka and Amazon Kinesis overcome scale limitations of traditional messaging, enabling high throughput pub/sub, making them industry standards for organizations processing thousands of events per second.
Change Data Capture (CDC) is your best approach for capturing database changes. Rather than implementing dual writes, which create consistency nightmares and operational complexity, CDC reads transaction logs directly from your source systems with minimal performance impact. CDC works well for PostgreSQL, MySQL, SQL Server, and MongoDB, capturing inserts, updates, and deletes without full table scans. This log-based approach keeps your source systems untouched while ensuring you never miss a change.
Once events flow into your streaming platform, two patterns unlock sophisticated analytics use cases. The fan-out pattern routes a single event stream to multiple consumers, allowing different teams to build independent analytics pipelines without duplication. A financial services firm might fan out transaction events to fraud detection, compliance reporting, and customer analytics simultaneously.
The stream-table join pattern enriches live events with reference data for critical context. Stream-table joins combine live events with static data like joining transactions with customer profiles, enabling real-time personalization. In supply chain scenarios, joining inbound shipment events with inventory tables triggers automatic reorder decisions. In IoT applications, enriching sensor readings with device metadata and location data surfaces actionable insights instantly.
Design your ingestion layer for reliability first. Implement idempotent consumers to handle duplicate messages gracefully, and monitor end-to-end latency from source to sink. These patterns form the foundation for analytics architectures that scale without breaking.
Stream Processing, Storage, and Exactly-Once Semantics
Stream processing frameworks like Apache Flink and Spark Streaming form the computational backbone of real-time analytics. They consume events from your message brokers and apply transformations, aggregations, and machine learning models while data is in flight. This matters because waiting for data to land in storage before processing introduces unacceptable latency for fraud detection, dynamic pricing, or supply chain visibility.
The challenge emerges immediately: events rarely arrive in order. A payment authorization from 2:15 PM might reach your system after one from 2:17 PM due to network variability. Stream processors handle this through event time and watermarks, per Cloudera's streaming semantics guide. Windowing strategies group events by their actual timestamp, not arrival time, ensuring your fraud model sees transactions in the sequence they occurred, not the sequence they landed.
For financial and compliance workloads, exactly-once semantics become non-negotiable. You cannot afford duplicate charge transactions or missed regulatory events. Apache Flink achieves exactly-once through checkpointing of operator state, barriers that coordinate progress, and recovery. Think of checkpoints as snapshots: the framework periodically captures the state of every operator (running counts, session windows, ML model parameters) and writes it to durable storage. If failure occurs, the system replays from the last checkpoint, reprocessing events to that exact point without duplication.
State management is where complexity lives. Your stream processor maintains keyed state for sessionization (grouping user actions), running aggregations (inventory levels across warehouses), and business logic (fraud scoring per merchant). This state must be queryable, recoverable, and horizontally scalable.
Recovery mechanisms must replay from durable sources, typically your Kafka cluster, to consistent points. Without this capability, you lose both data and compliance auditability.
Real-Time Databases and API Layers
Traditional data warehouses weren't built for what you're doing right now: ingesting millions of events per second and serving query results in milliseconds. Real-time databases flip the optimization priority. Instead of maximizing analytical complexity across historical data, they're engineered for velocity and latency.
ClickHouse, Druid, and Pinot exemplify this shift. ClickHouse compresses data aggressively while maintaining sub-second query performance on billions of rows. Druid specializes in time-series storage, making it ideal for IoT sensor streams or financial tick data where temporal ordering matters. Pinot handles high-frequency ingestion without sacrificing query freshness. Each excels because they abandon the batch-processing mindset entirely.
But a database alone doesn't activate data. That's where API layers become critical infrastructure. APIs serve real-time analytics in various formats like JSON, CSV, and Parquet to downstream applications, enabling product teams, mobile apps, and customer dashboards to consume live insights directly. A supply chain team using real-time inventory analytics, for example, doesn't need dashboard access; they need APIs feeding alerts into their warehouse management system.
The semantic layer sits between your database and these applications, providing a centralized repository for metric definitions. A semantic layer is abstraction sitting between enterprise data and business users as centralized repository for metric definitions. This prevents conflicting revenue calculations across teams and ensures finance, marketing, and operations speak the same data language.
Governance and security layers wrap everything. Real-time doesn't mean uncontrolled. Row-level access controls, encryption, and audit logging ensure compliance while maintaining performance. The architecture succeeds when data reaches decision-makers faster than problems compound.
Real-Time Analytics Patterns: Fraud Detection, Inventory, and Supply Chain
Real-time analytics patterns solve fundamentally different business problems, yet they share the same architectural backbone. Understanding how to apply these patterns across domains determines whether your implementation delivers measurable ROI or becomes an expensive data project.
Fraud Detection: The Immediate Block
Financial institutions process millions of transactions daily. A fraud detection system can block suspicious transactions before they are completed using real-time analytics, reducing fraud losses by 60-80% compared to batch detection. Your architecture ingests transaction streams through Kafka, enriches them with customer history and behavioral models, and routes flagged transactions to ML models within milliseconds. The fan-out pattern here is critical: one transaction triggers parallel checks across fraud rules, velocity limits, and neural networks simultaneously. A major payment processor we've worked with reduced false positives by 35% while catching 94% of actual fraud by tuning this pattern.
Inventory Optimization: Continuous Visibility
Real-time inventory analytics enables businesses to track stock levels continuously, preventing costly stockouts. Your warehouse management system streams inventory movements; IoT sensors track physical stock; ERP systems confirm committed orders. Stream-table joins connect these sources, calculating available-to-promise inventory in real time. The business impact is direct: one retailer reduced stockouts by 22% while cutting excess inventory by 18%, freeing $2.3M in working capital.
Demand Sensing: Market-Driven Forecasting
Real-time data improves demand forecasting by integrating sales trends, market signals, and social media activity. This pattern combines point-of-sale data, competitor pricing feeds, social sentiment, and weather patterns into unified demand models updated hourly, not weekly. Supply chains using this approach reduce forecast error by 25-35%, enabling faster response to market shifts.
The pattern repeats across domains: ingest streams, enrich with context, join with reference data, apply logic, act immediately. Master this framework and you'll design systems that actually move business metrics.
Design Principles, Challenges, and Implementation Roadmap
Building a real-time analytics architecture requires discipline around five non-negotiable principles. First, design for idempotency so processing duplicate messages doesn't corrupt your data or metrics. This matters more than you'd think; network retries and system restarts will send duplicates your way. Second, monitor end-to-end latency from source to insight, not just component processing times. A pipeline that processes events in 50 milliseconds but takes 2 seconds to surface insights isn't actually real-time for your business. Third, implement strong data governance early. Continuous data flows introduce new compliance and quality risks that batch systems never faced.
The biggest pitfalls we see: teams underestimate infrastructure complexity, overestimate their data quality, and skip observability until fires start. Your monitoring and alerting stack matters as much as your processing layer.
For implementation, start narrow. Pick your highest-value use case, whether that's supply chain visibility, fraud detection, or IoT anomaly detection. Prove ROI on a focused problem before scaling the architecture enterprise-wide. This approach lets you learn failure modes at manageable scale and build organizational buy-in with concrete wins.
Plan for failure explicitly. Real-time systems fail differently than batch pipelines. You need circuit breakers, graceful degradation strategies, and clear runbooks. Invest in observability from day one; it's not optional overhead.
Conclusion: Building Your Real-Time Analytics Foundation
You've now seen how real-time data analytics architecture works in practice, from ingesting your first data stream to serving insights that drive decisions. The truth is, this isn't about picking the fanciest tool or the most complex pipeline. It's about orchestrating the right components in service of a clear business outcome.
Real-time analytics has moved from technical curiosity to critical pillar of competitive advantage. Your supply chain competitors are already tracking shipment anomalies in milliseconds. Your finance rivals are detecting fraud patterns before transactions settle. IoT manufacturers are predicting equipment failures before customers even notice degradation. Speed of insight, not just speed of technology, determines who wins.
Here's what matters now: start somewhere concrete. Pick your highest-impact use case, not your most interesting technical problem. A supply chain visibility project or a fraud detection system will generate faster ROI and organizational credibility than a shiny proof-of-concept that nobody uses.
Then invest deliberately in the unglamorous foundations: observability to understand what's actually happening, governance to keep data trustworthy at scale, and team expertise to operate these systems sustainably. Tools change. Architecture patterns evolve. But your people and processes are what keep real-time systems running when pressure matters most.
Assess your current capabilities honestly. Evaluate platforms against your specific requirements, not analyst hype cycles. Partner with teams who've built this before. The architecture is learnable. The mistakes are expensive.
Your real-time transformation starts now. The competitive advantage is waiting.
Keep reading

Critical Third Parties: UK Cloud Rule Explained
A Critical Third Party is a provider whose service failure could threaten UK financial stability. The first UK designations are four cloud providers.

Netflix Earnings Put Always-On TV in Focus
Netflix reports Q2 results July 16 after reports it is weighing always-on channels. Arkolith maps NFLX to $284.0B in tracked 13F value.

UK Cloud Watchlist Maps to $4.45T in 13F Value
The UK's first cloud oversight list maps to Microsoft, Alphabet, Amazon and Oracle, which Arkolith tracks across $4.45T of Q1 2026 13F value.